Promotions and events like holidays or in-store sales often impact the performance of your digital marketing campaigns. It’s important to understand this impact and factor it into your optimization and media plans. If we can predict an increase in site traffic due to an event, we can increase budgets and bids on our paid media campaigns ahead of that event so that we capture as many new customers as possible. Let’s walk through the process of analyzing a recurring event’s impact in Google Sheets. I’ll pretend I work for a big retailer that runs ads during the Super Bowl, and I want to analyze past years’ performance and set benchmarks for this year’s upcoming ad.
Analyzing event data in spreadsheets
I’ve created a workbook that you can use as a template to aggregate your event data. The workbook also contains calendar templates for events that our clients commonly track. More on those later.
Here’s a step-by-step guide to analyzing event data in spreadsheets, using the Super Bowl as an example.
- Export Historical Data
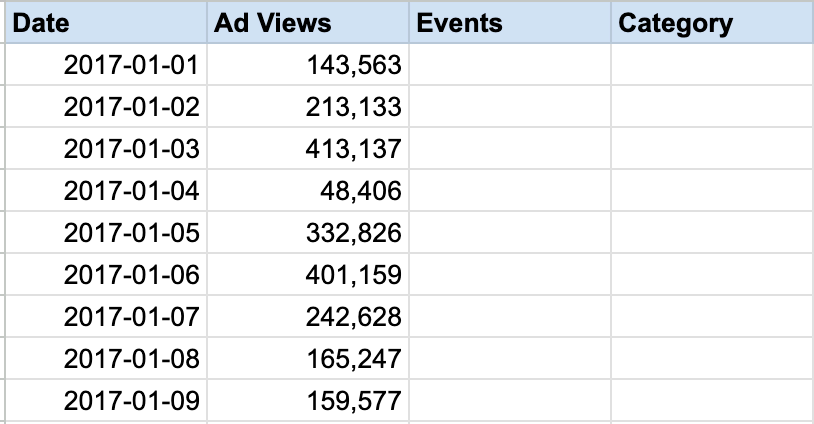
In your publisher tool or reporting system, export the data you want to analyze, segmented by date. In this example, I want to analyze ad views. So I did a data export with two columns – date and ad views – and pasted that in the Sample Data tab. Then, I added two new columns – Events and Category.
- Create calendar
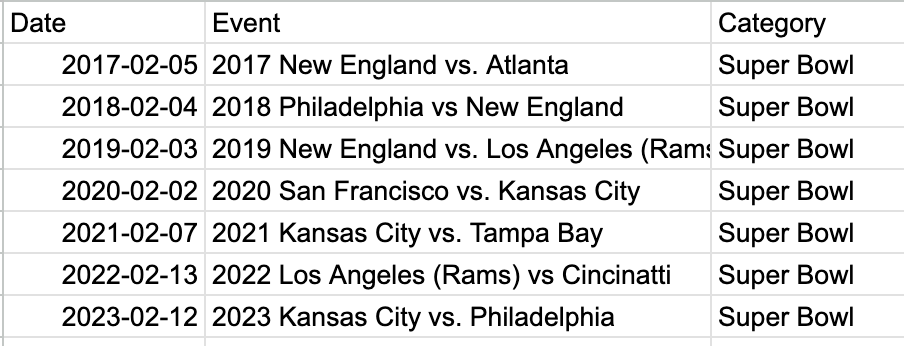
In the Sample Calendar tab, I created an event calendar that lists each instance of the Super Bowl and its date. I also recommend adding a Category label if you’re tracking more than one type of event. In this example, I’m keeping it simple and just tracking the Super Bowl. But you could track all your different event types, like sales, promotions, and holidays, in one unified calendar and label events by category. This way, you’ll be able to pivot on the category column and compare different event types.
- Lookup Event Info
Use lookup formulas to populate the Events and Categories into their columns in the Sample Data tab. You’ll want to lookup against the dates in the Sample Calendar tab. To populate the ‘Events’ column, use this formula:
=xlookup(A3,'Sample Calendar'!$A$2:$A$8,'Sample Calendar'!$B$2:$B$8,"None")
Paste that formula in cell C2 and double-click on the bottom-right corner of the cell to populate all other rows.
To populate the ‘Category’ column, use this formula:
=xlookup(A2,'Sample Calendar'!$A$2:$A$8,'Sample Calendar'!$C$2:$C$8,"None")
Paste that formula in cell D2 and double-click on the bottom-right corner of the cell to populate all other rows.
Here's a tutorial on xlookup formulas that you can reference when writing your formulas.
- Create a Pivot Table
In your data tab, select columns A-D and click insert > pivot table.
Now I have a pivot table that shows the number of ad views during each Super Bowl:
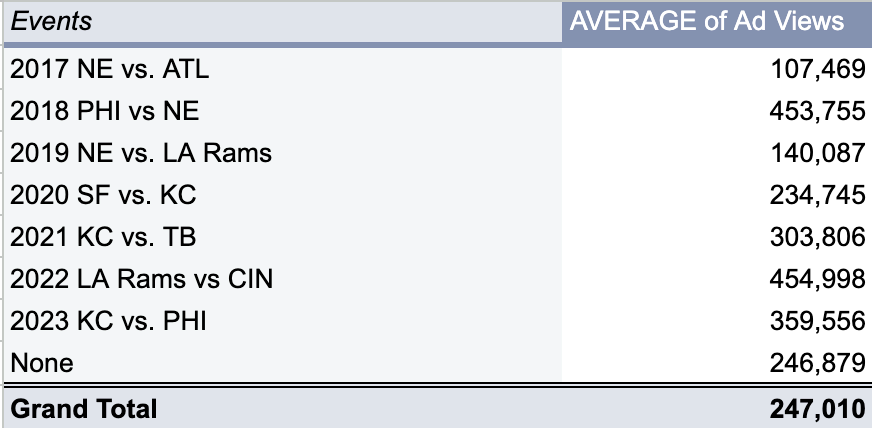
I created an additional table in the Sample Pivot Table tab that shows the average number of ad views on Super Bowl days vs. non-Super Bowl Days. This way, I can see how much of a lift in volume the Super Bowl drives. In cell C14, I’ve used a simple change formula to calculate that the Super Bowl drives an average +19% lift in volume.
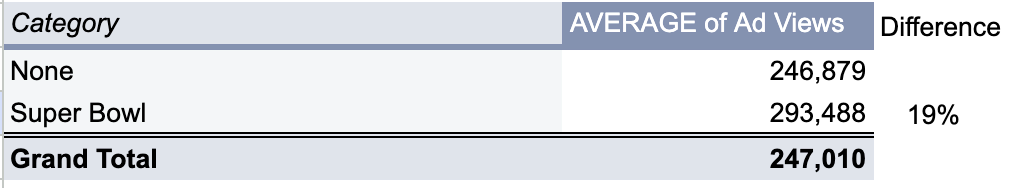
This is powerful information. I now know to increase my budgets by at least 19% to prepare for the influx in traffic. You could also look at conversion rate changes for the same period to determine how to adjust your bidding targets.
- Create data visualizations
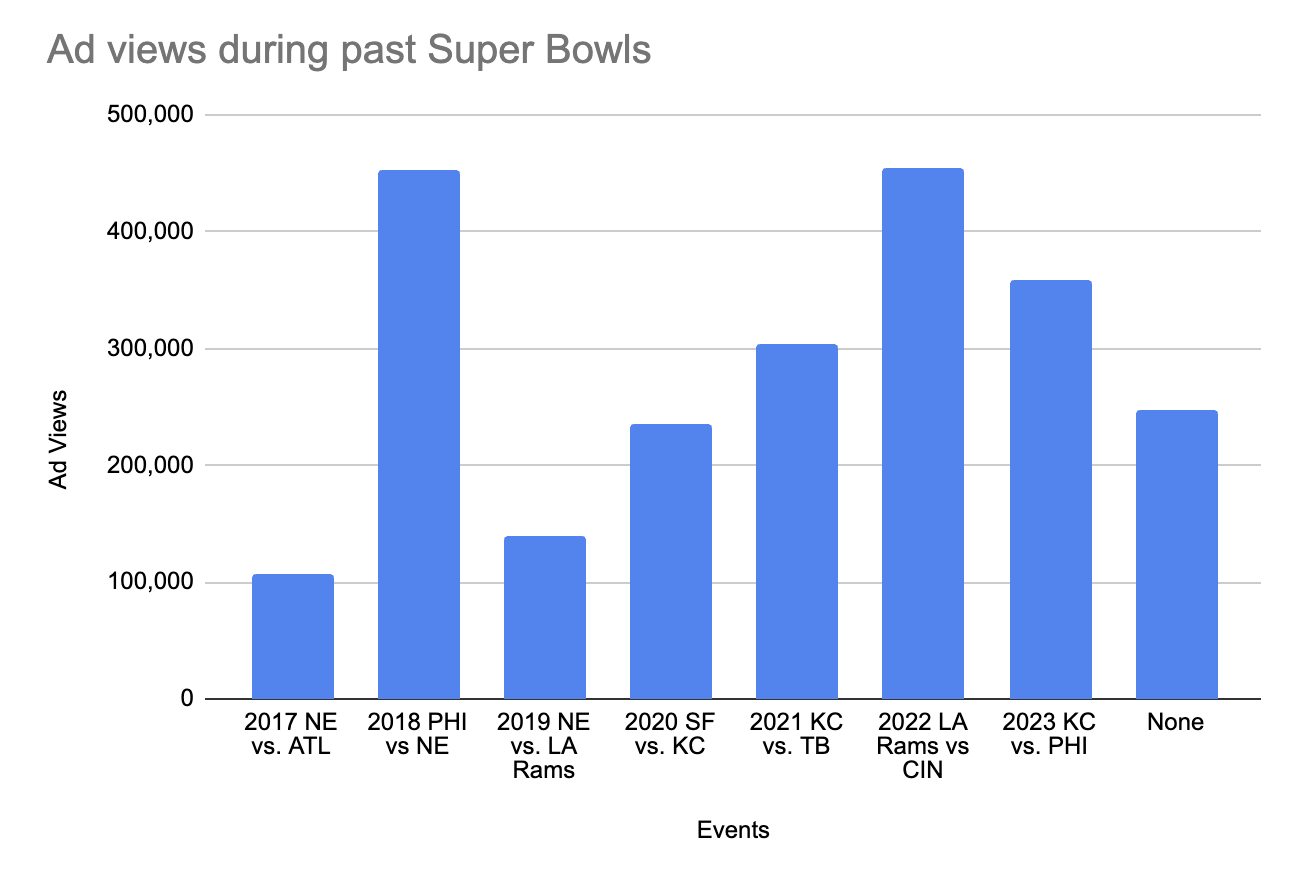
In the pivot table tab, select cells A1 - B9 and click insert > chart. Select the chart type that works best for you.
I’ve gone with a column chart using the event name as my horizontal axis and the ad views as my vertical axis. The chart shows that ad view volume increased steadily from 2019 - 2022, followed by a slight drop in 2023. With this data, I could set a realistic goal for this year’s Super Bowl ad, like bringing ad views back up to 2022 levels.
I’ve also created an area chart with a trend line to display the positive YoY trends to my company’s leadership. The trendline shows that even though we saw a decline in ad views last year, the overall trend for the past five years is significantly positive.
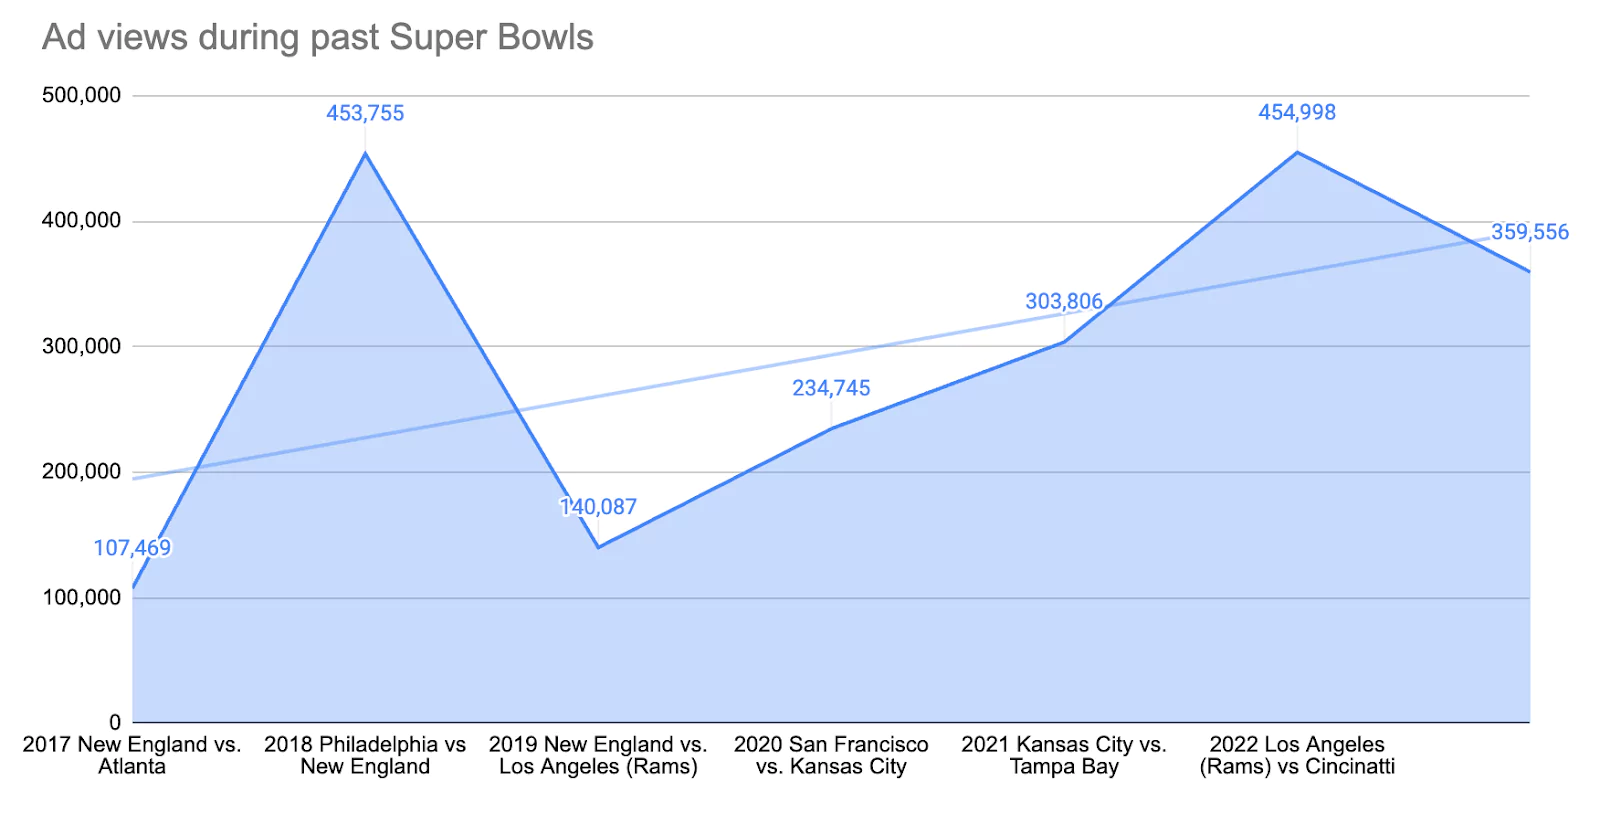
And there you have it! Two easy visualizations of ad views for every Super Bowl since 2017.
Calendar templates
Creating a spreadsheet that outlines every date on which the Super Bowl occurred for the past five years was tedious, so I’ve included a few calendars with historical dates for key events in the workbook for you to reference. In the first three tabs, you’ll find a Cyber Week calendar, Super Bowl calendar, and US Holiday calendar with historical dates for the past few years.
Turning your event data into action
Analyzing year-over-year performance changes for a recurring event helps to prepare for future iterations of that event. Consider using your historical event data to set benchmarks or minimum thresholds for recurring events’ performance. For example, if your Annual Sale has been generating a year-over-year revenue growth of 5%, you can set a sales target for your next Annual Sale by increasing last year’s revenue by 5%.
You can also consider increasing your ad budget and/or bid targets based on this expected influx of traffic. If you predict that an upcoming event is going to drive additional searches for your products, consider increasing the budgets for your non-brand campaigns. Brand campaigns can likely remain stable. Extra money spent on brand terms is often wasted as those Googling your brand name will likely end up on your site regardless of if they see an ad. Just make sure your competitors aren’t bidding for the top spots in the SERP on your brand’s keywords in an attempt to capitalize on your increased search volume. But assuming you’re already running brand campaigns to defend your spot at the top of the SERP, you should be all set.
Inversely, you could track your top competitors’ annual sales and promotions and scale up bids and budgets on competitor terms during those periods to try and acquire some of their traffic. But keep in mind that competitor terms are some of the most expensive to bid on, and you’ll need some very compelling ad copy to lure searchers away from the brand they were originally looking for, and on to your page instead.
Automate event analysis with Marin’s Marketing Calendar
The process outlined above is time-consuming if you are doing it manually – and you have to repeat it for every new event! Instead, do it automatically with Marin’s automation across all your campaigns, accounts, and publishers.
With Marin’s Marketing Calendar, you just upload your event calendar into our platform, and AI will do the rest. Simply create a spreadsheet containing details like Event Name, Start Date, End Date, and optional details like Category and Description:
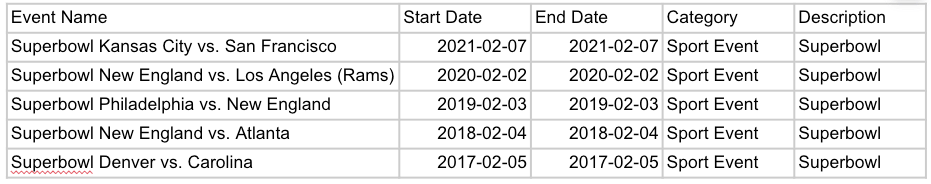
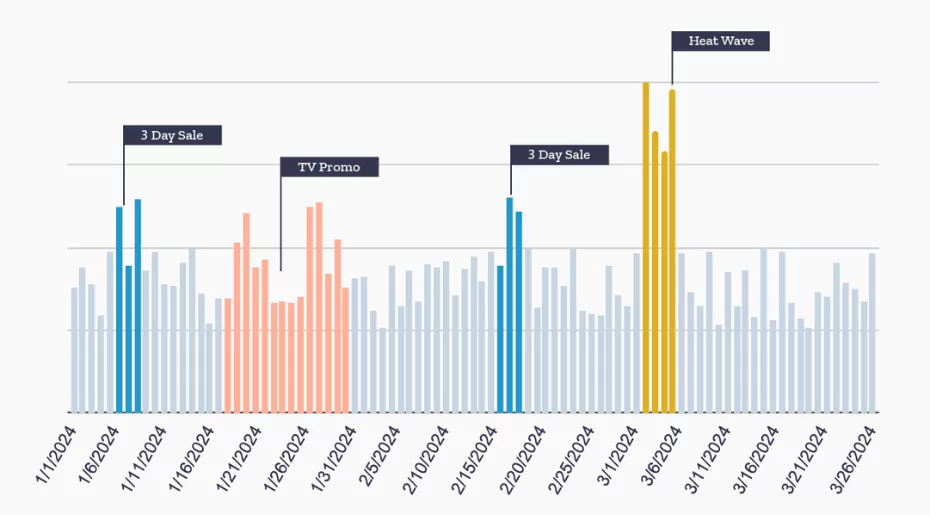
Marin will then chart year-over-year event data for you so that you can analyze past trends and plan for future iterations of the events.
Marin does the analysis and data visualization for you so you can spend more time focusing on turning that data into action.
Outperform the competition
We all know that the actions of your competitors directly impact your campaigns – and Marketing Calendar’s got your back here, too! Are competitor promotions driving down your metrics? Now you can tag those dates to easily identify the performance outliers and set your campaigns to combat these negative impacts in advance. All you have to do to track the impact of competitors’ promotions on your business is upload their event data into the platform. And you can store that data in Marin for years.
Did a competitor promotion get you down this year? With Marketing Calendar, you’ll see around the corner next year and be able to get ahead of the increase in competition.
With Marin’s Marketing Calendar, marketers can plan, execute, and monitor campaigns with incredible precision. To learn more, schedule a demo with one of our Digital Marketing experts today.